Technical indicators are part of technical analysis and are used to help you make informed trading decisions. Together with the appropriate risk management tools, they can help you evaluate price trends.
Using data, price and volume, technical indicators can indicate the direction of a financial asset's trend over a predetermined period of time. This information can help you identify the best trading opportunities.
What types of technical indicators are there?
Technical indicators include leading and lagging indicators. A leading indicator is one that signals the price of an asset before the initial movement, while a lagging indicator signals the current trend after the initial movement.
What are the commonly used technical indicators?
01. Moving Average (MA)
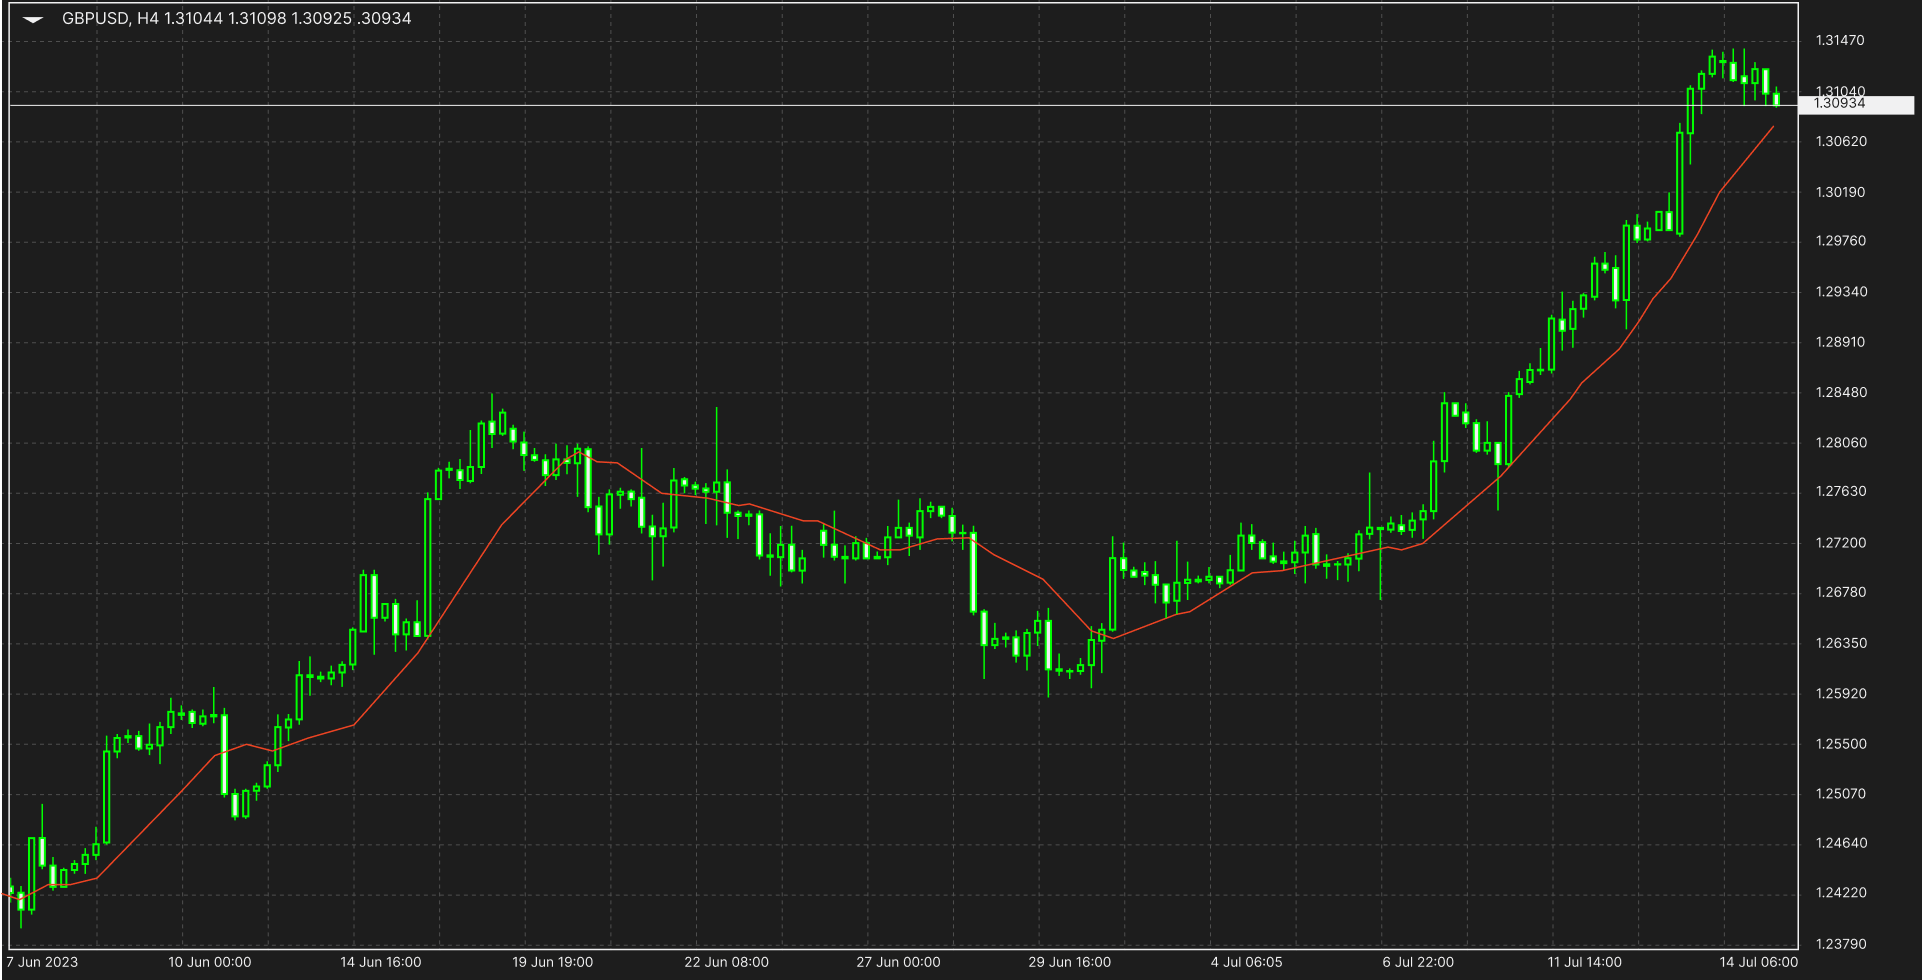
It is one of the most popular lagging technical indicators used to identify ongoing price trends in the market. It combines the price points of an instrument over a specified time frame (15, 20, 30, 50, 100 or 200 candlesticks or periods) and divides the data points by the number of data points to arrive at a trend line. Averaging the data in this way confirms the direction of the current trend while mitigating the effects of random price fluctuations.
In most cases, when prices rise above the moving average, the current trend is considered to be upward, and when prices fall below the moving average, the current trend is considered to be downward.
There are many different types of moving averages and some traders use more than one to confirm their signals. Some examples include simple moving averages and exponential moving averages (which give more weight to the nearest number).
02. Exponential Moving Average (EMA)
The Exponential Moving Average (EMA) is a technical indicator designed to improve the concept of the Simple Moving Average (SMA) by giving more weight to the most recent price data, which is considered to be more relevant than older data.
It is placed like a line on a price chart and is based on a mathematical formula to smooth out price movements. By giving more weight to the latest prices and less weight to previously occurring prices, the EMA adapts more quickly to the latest price changes in the price data than the SMA, which applies equal weight to all observations in the cycle.
To use the EMA, select the EMA indicator in our MT4 platform. You can also adjust the number of periods it should calculate. Traders usually use 50, 100 and 200 periods when tracking price action back over months or years. On the other hand, 12- and 26-period EMAs are popular for shorter time frames.
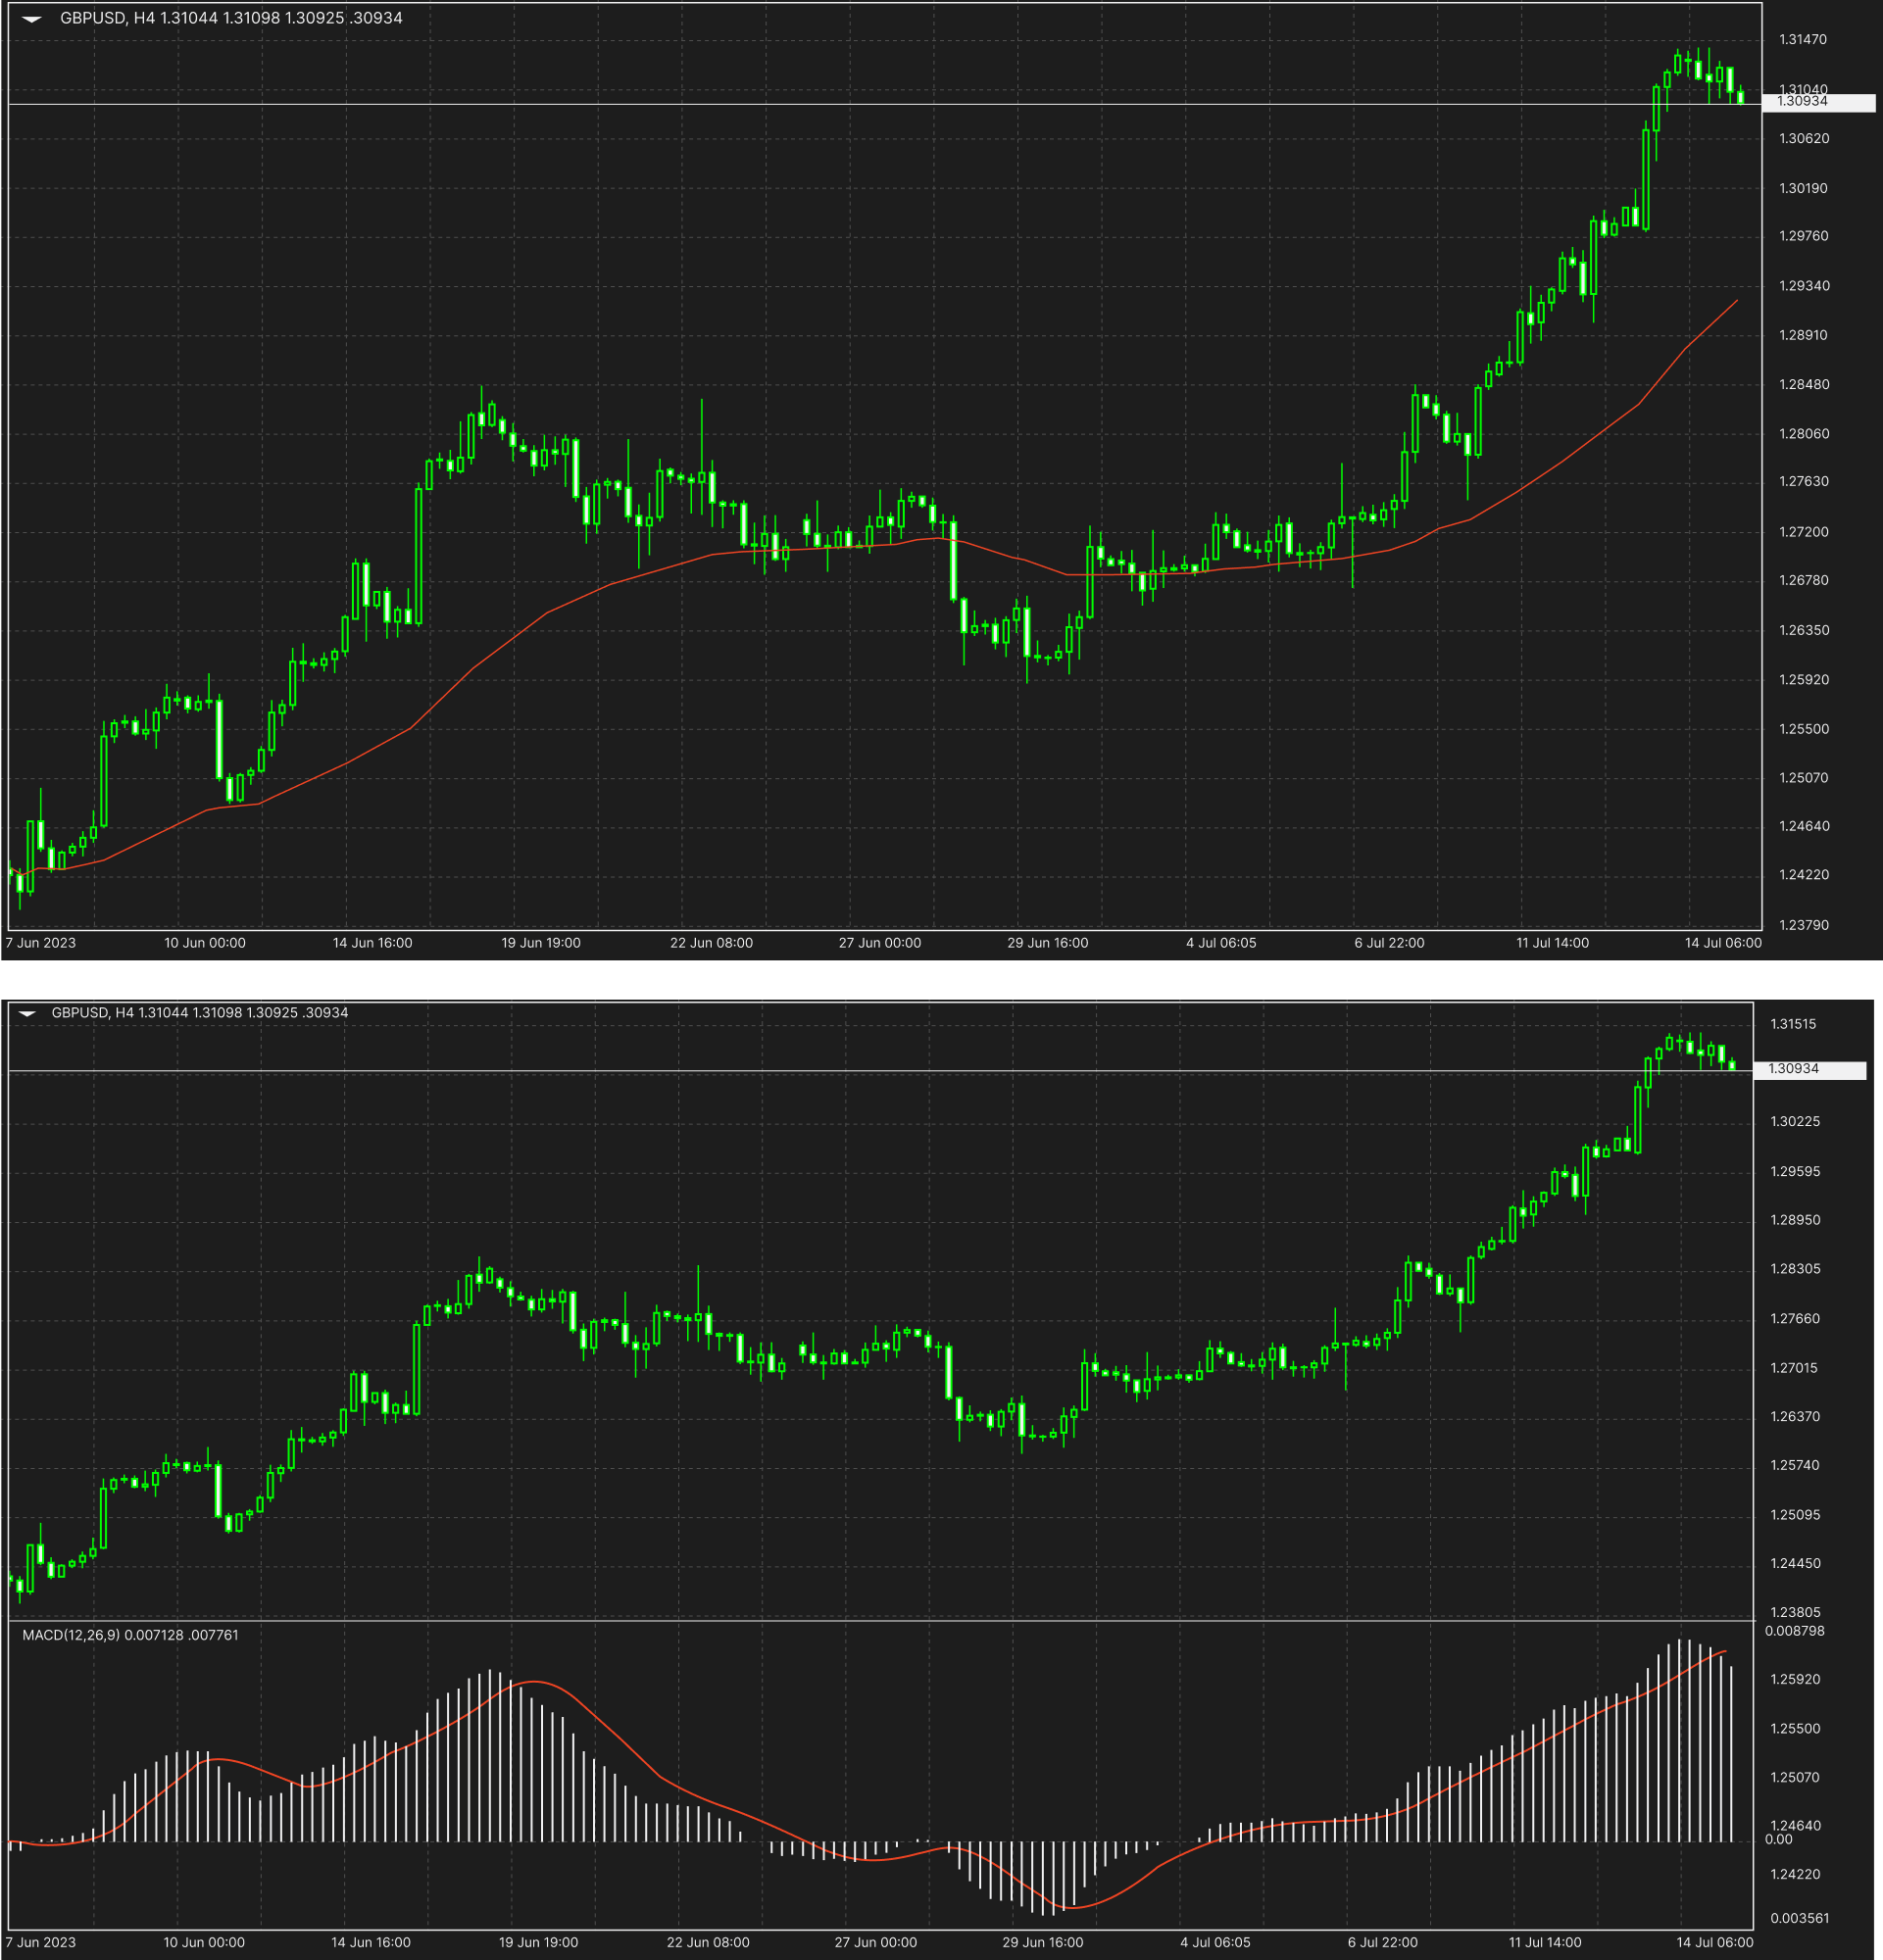
03. Moving Average Convergence/Divergence (MACD)
The Moving Average Convergence/Divergence (MACD) is a trend-following momentum indicator that shows the relationship between two moving averages of an instrument's price.The MACD is calculated by subtracting the 26-period EMA from the 12-period Exponential Moving Average (EMA).
MACD = 12-period EMA - 26-period EMA
The result of this calculation is the MACD line, the nine-day EMA of the MACD is known as the "signal line". It is plotted above the MACD line as a trigger for buy and sell signals. Traders may buy when the MACD line crosses its signal line and sell when the MACD line crosses below the signal line. The Moving Average Convergence/Divergence Index (MACD) can be interpreted in a number of ways, but the more common methods are crossovers, divergences and rapid rises/declines.
04. Relative Strength Index (RSI)
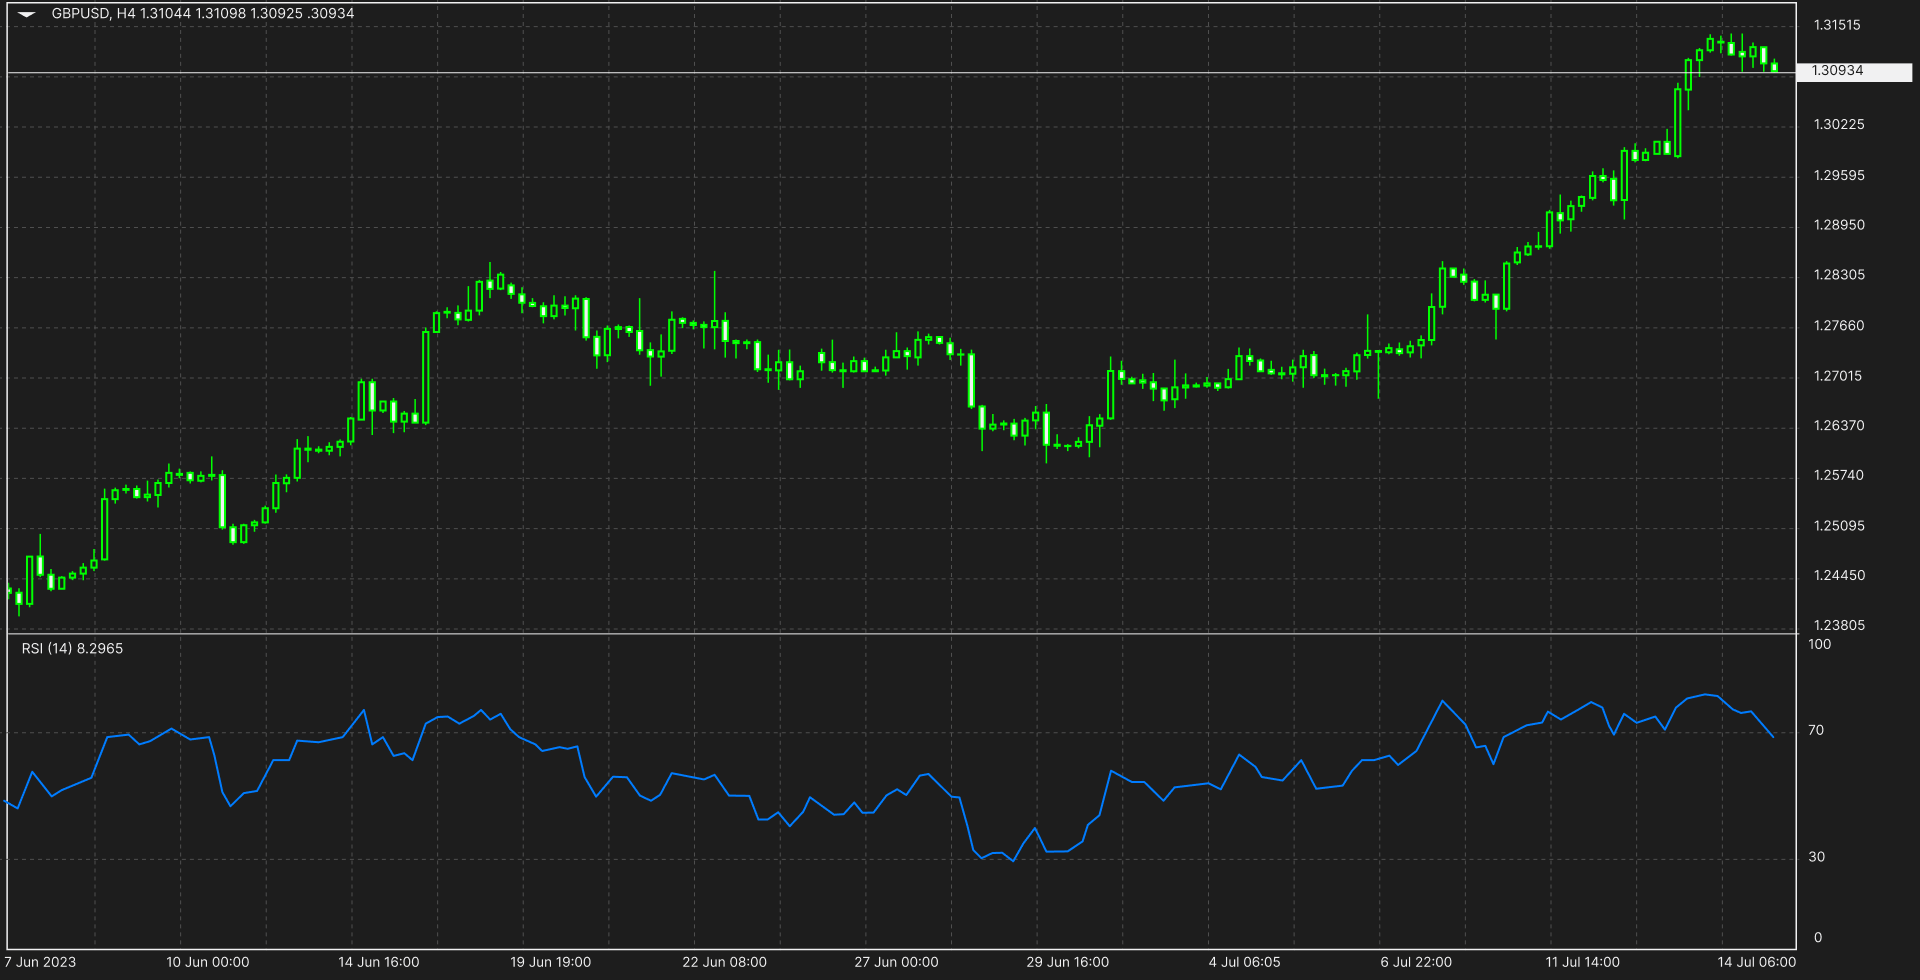
The Relative Strength Index (RSI) is a momentum indicator used in technical analysis to measure the magnitude of recent price changes in order to assess overbought or oversold conditions in asset prices. It is displayed as an oscillator (a line moving between two extremes) and can have a reading of 0 to 100.
In the traditional Relative Strength Index sense, all values above 70 may indicate that an asset is being overbought and may be poised for a trend reversal or retracement. On the other hand, RSI values below 30 may indicate that an asset is oversold and undervalued. These lines are known as overbought and oversold lines.
When the RSI line crosses and moves up above the oversold line (30), the RSI indicates a potential buy signal. When the RSI line crosses below the overbought line (70), the RSI shows a potential sell signal.