This is a concept that investors should be familiar with as it is crucial to any analysis. It serves as a benchmark for determining where the market is likely to move in the next trading day, as well as identifying key support and resistance levels for different assets, including forex, equities and commodities markets.

How are these points calculated?
Determining Pivot Points (PPs) involves calculating the past price for a given period. To do this, analysts use several methods, the most popular of which are Woodie's Pivot Points, Classic Pivot Points, and Camarilla's Pivot Points, which we'll discuss in more detail later. But before we delve into these methods, let's further elaborate on the pivots themselves.
A pivot point is a market turning event that indicates the price expectation for the next trading day. If the price is trading above the pivot point, it indicates a bullish market trend. Conversely, if the price is trading below it, it indicates a bearish market trend.
Pivot points are used to identify key support and resistance levels. Key support and resistance levels include support levels S1, S2, and S3, and resistance levels R1, R2, and R3. When prices are falling, support level S1 is the strongest support level and the first support level to watch. Similarly, when price rises, R1 is the strongest resistance level and the first resistance level to watch.
There are different types of pivot point calculations:
There are three main types of pivot point calculations using historical prices:
01. Classic method
In the Classic method, the high, low and closing prices of the previous trading day are calculated, added together and divided by three. This average is used as the main PP for the next day and the determination of support and resistance levels is based on other values calculated using the previous prices. As for the other levels, they can be calculated using the following rules:
- Support 1 (2 x Typical PP) - Highest price of the previous trading day
- Support 2 Typical PP - (Highest price of the previous trading day - Lowest price of the previous trading day)
- Support 3 Lowest price of the previous trading day - (2 x((Highest price of the previous trading day - Typical PP))
- Resistance 1 (2 x Typical PP) - Lowest price of the previous trading day
- Resistance 2 Typical PP + (Highest price of the previous trading day - Lowest price of the previous trading day)
- Resistance 3 Highest price of the previous trading day + (2 x (Typical PP - Lowest price of the previous trading day))
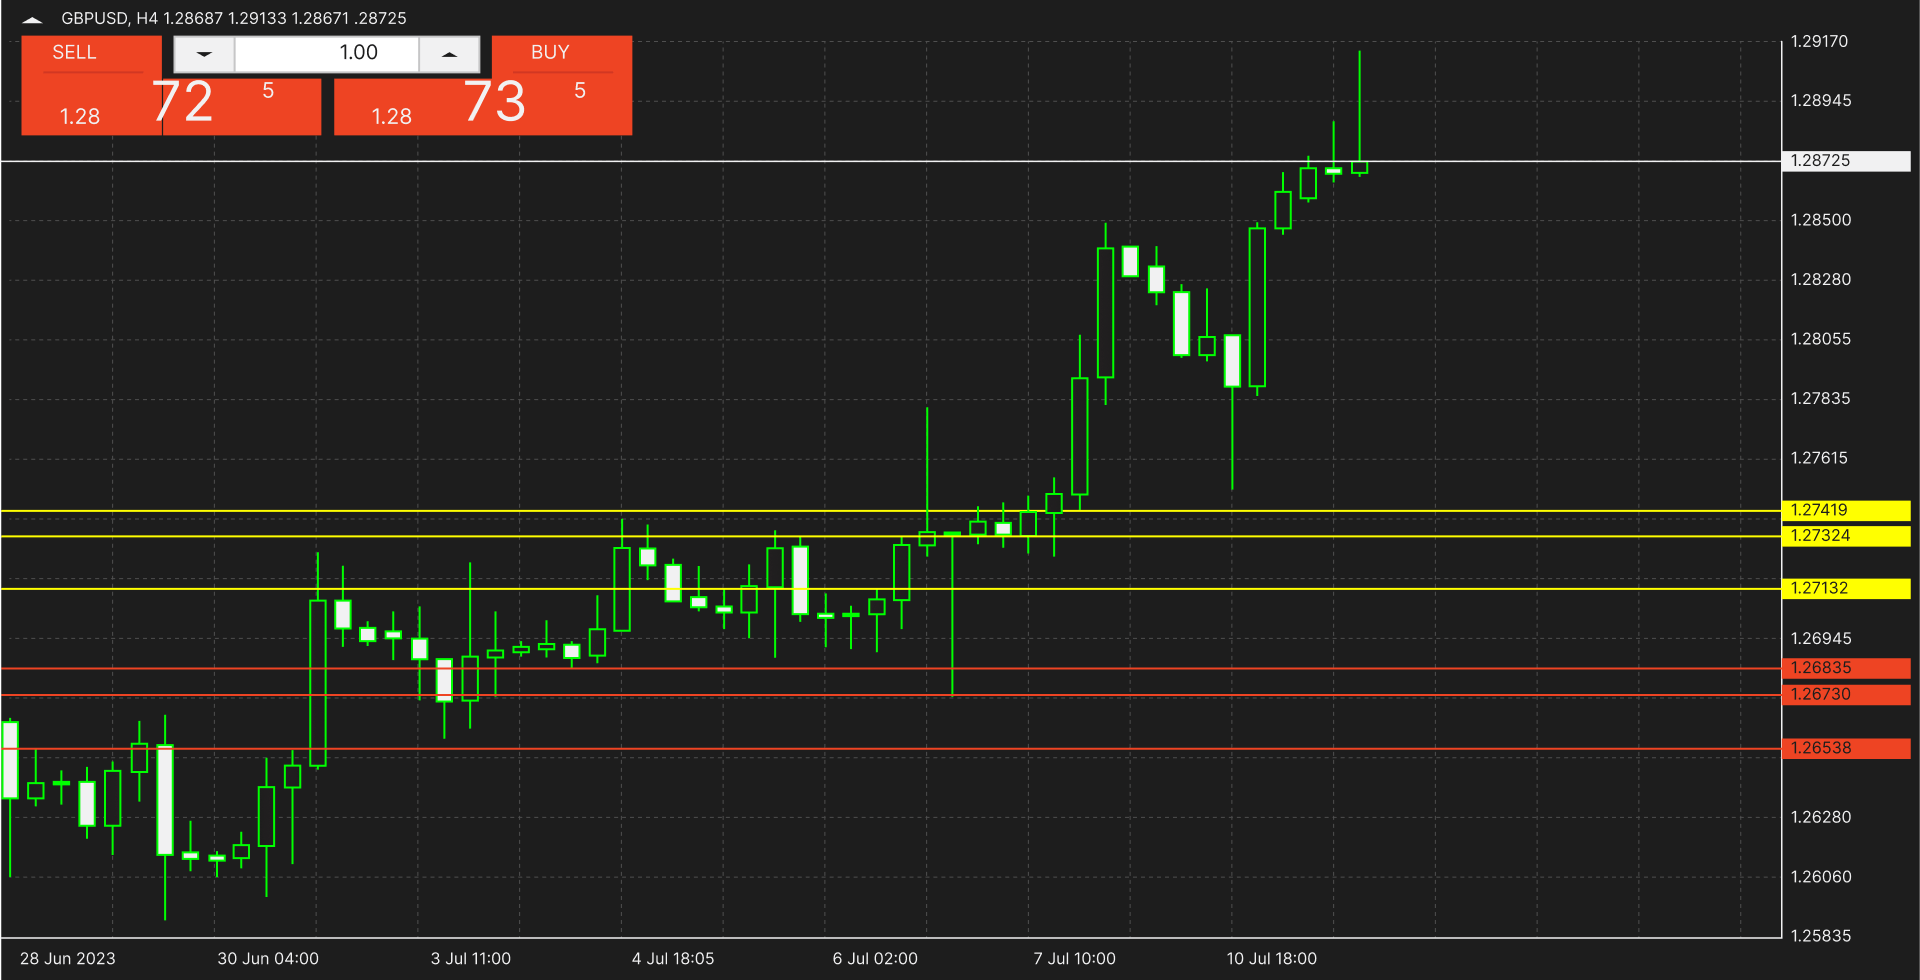
Example:2023-07-01 GBPUSD
Opening Price(O):1.27086 High(H):1.27219 Lowest Price(L):1.26922 Closing price(C):1.26939
Typical PP: (High+Lowest Price+Closing price)/3 = (1.27219+1.26922+1.26939)/3 = 1.27027
Calculate the support and resistance levels according to the above formula.
Support1:1.26835,Support2:1.2673,Support3:1.26538
Resistance1:1.27132,Resistance2:1.27324,Resistance3:1.27419
02. Fibonacci Method (Fibonacci)
The Fibonacci method is a calculation method similar to the classical PP, which includes the Fibonacci levels to derive other values. Other levels can be calculated as follows:
- Support 1 Typical PP - (0.382 Highest price of the previous trading day - Lowest price of the previous trading day))
- Support 2 Typical PP - (0.618 Highest price of the previous trading day - Lowest price of the previous trading day))
- Support 3 Typical PP - (1.000 Highest price of the previous trading day - Lowest price of the previous trading day))
- Resistance 1 Typical PP +(0.382 Highest price of the previous trading day - Lowest price of the previous trading day))
- Resistance 2 Typical PP +(0.618 Highest price of the previous trading day - Lowest price of the previous trading day))
- Resistance 3 Typical PP +(1.000 Highest price of the previous trading day - Lowest price of the previous trading day))
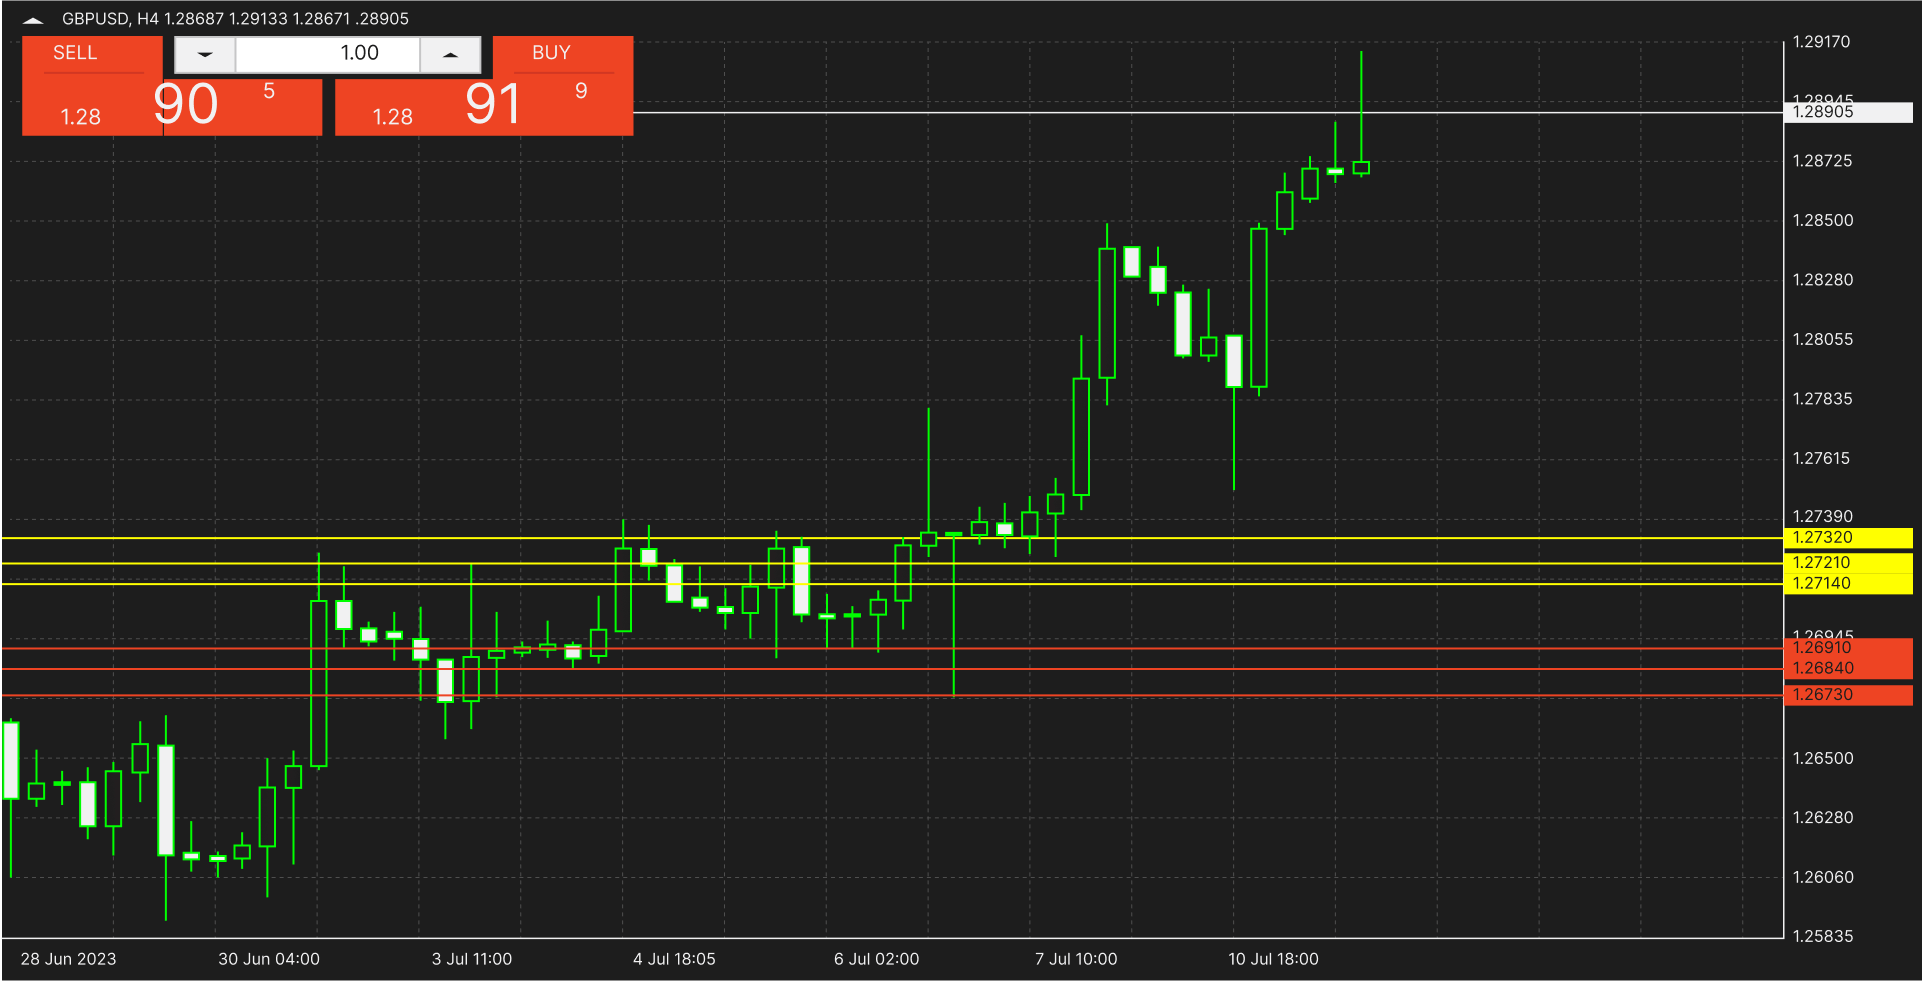
Example:2023-07-01 GBPUSD
Opening Price(O):1.27086 High(H):1.27219 Lowest Price(L):1.26922 Closing price(C):1.26939
Typical PP: (High+Lowest Price+Closing price)/3 = (1.27219+1.26922+1.26939)/3 = 1.27027
Calculate the support and resistance levels according to the above formula.
Support1:1.2691,Support2:1.2684,Support3:1.2673
Resistance1:1.2714,Resistance2:1.2721,Resistance3:1.2732
03. Woodie's method
Woodie is a calculation method developed by Tom Woodie and is one of the most popular calculation methods. Although similar to the typical method, the Woodie method differs from the classic method in that it takes into account a number of factors, such as the current closing price, the previous closing price, and price changes. The formula used to calculate Woodie's PP is as follows:
PP = (H + L + 2C) / 4
R1 = (2 * PP) – L
R2 = PP + H –
L
S1 = (2 * PP) – H
S2 = PP – H + L
Where: C is the last closing price.
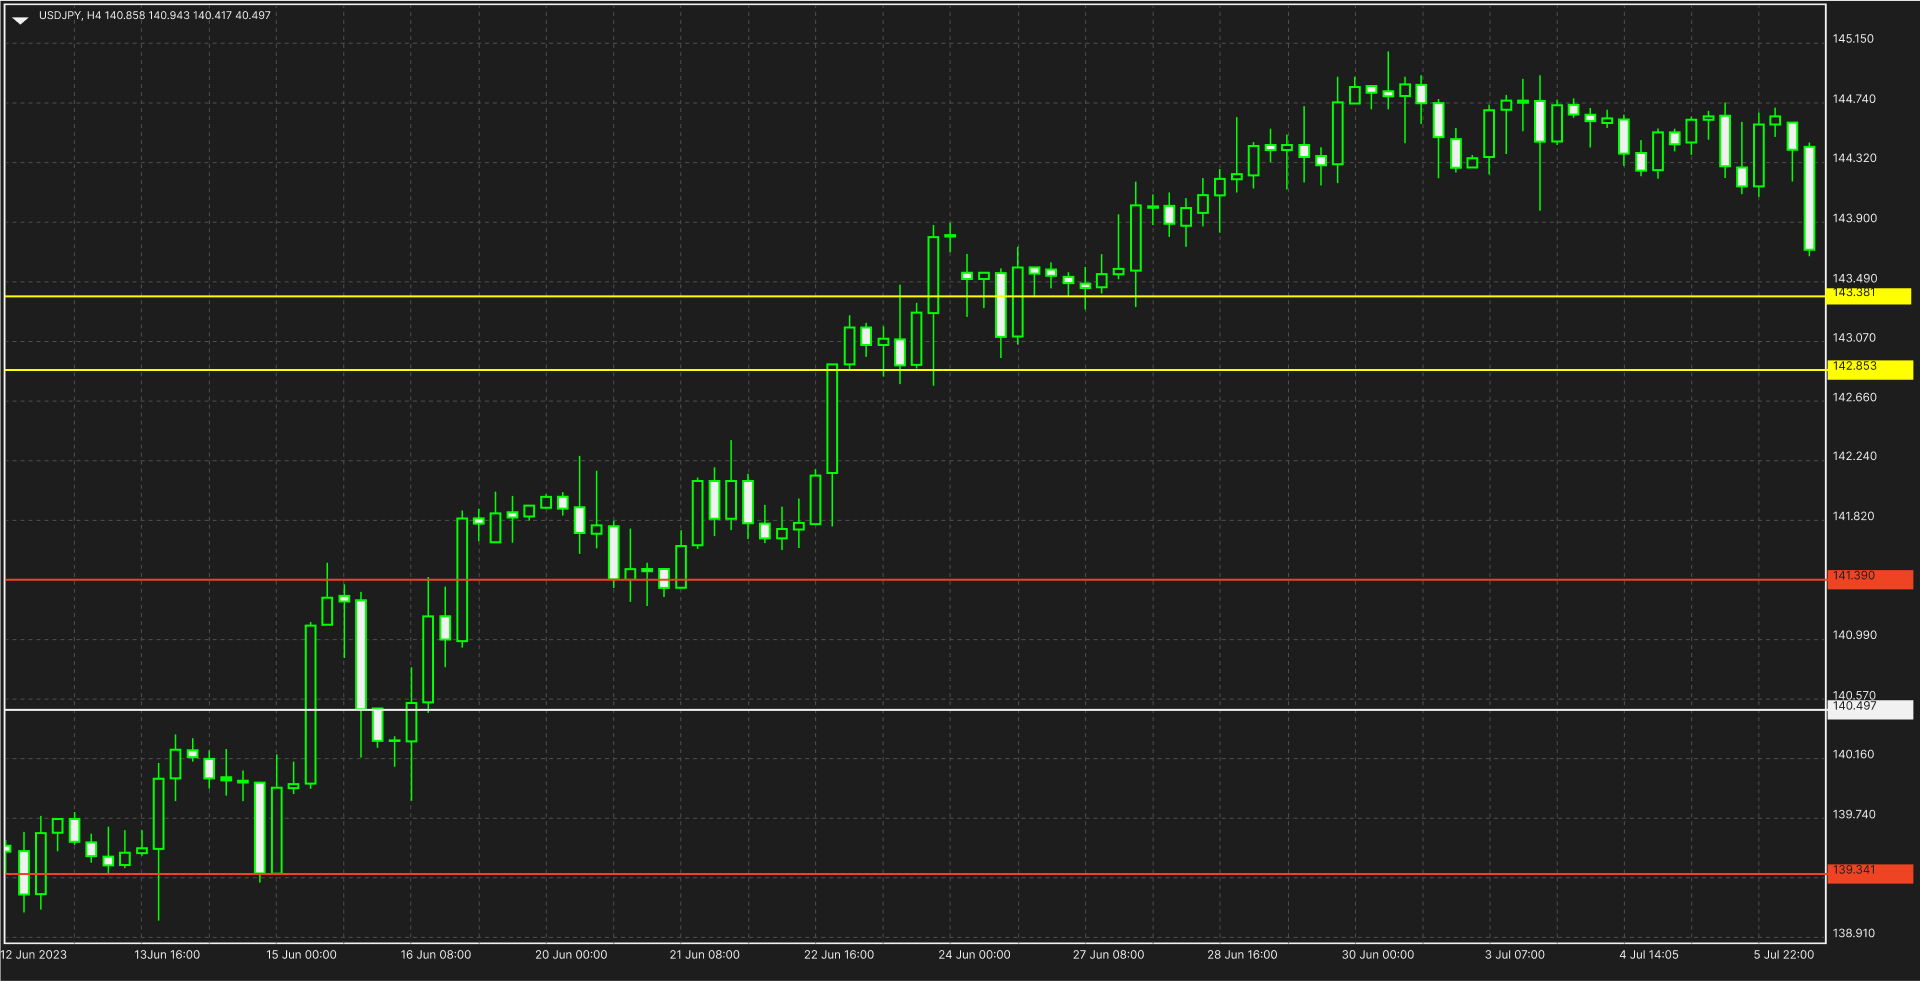
Example:2023-06-16 USDJPY
Opening Price(O):140.515,High(H):141.89,Lowest Price(L):139.87,Closing price(C):141.843
Typical PP:(High+Lowest Price+2*Closing price)/ 4 = (141.89+139.87+2*141.843)/4 = 141.3615
Calculate the support and resistance levels according to the above formula.
R1:142.853,R2:143.3815
S1:141.39,S2:139.3415
Determining the Pivot Point (PP) involves calculating the past price given a specified period. To do this, analysts use several methods, the most popular of which are Woodie's Pivot Point, Classic Pivot Point, and Camarilla's Pivot Point, which we will discuss in more detail later. But before we delve into these methods, let's further elaborate on the pivots themselves.
A pivot point is a market turning event that indicates the price expectation for the next trading day. If the price is trading above the pivot point, it indicates a bullish market trend. Conversely, if the price is trading below it, it indicates a bearish market trend.
Pivot points are used to identify key support and resistance levels. Key support and resistance levels include support levels S1, S2, and S3, and resistance levels R1, R2, and R3. When prices are falling, support level S1 is the strongest support level and the first support level to watch. Similarly, when price rises, R1 is the strongest resistance level and the first resistance level to watch.
Ø PP =(High + Low + Closing)/ 3
· R4 = C +(H-L)x 1.1/2
· R3 = C +(H-L)x 1.1/4
· R2 = C +(H-L)x 1.1/6
· R1 = C +(H-L)x 1.1/12
· S1 = C -(H-L)x 1.1/12
· S2 = C -(H-L)x 1.1/6
· S3 = C -(H-L)x 1.1/4
· S4 = C -(H-L)x 1.1/2
An example of how these points are calculated:
Situation 1. The opening price is between R3 and S3.
Buy when the price falls below S3 from R3 and rallies above S3. Targets will be R1, R2, R3 levels, stop loss can be placed at S4 level.
Wait for the price to rise to R3 and then fall below S3 again to sell or short. Targets would be S1, S2, S3 levels, with stops above R4.
Situation 2. The opening price is between R3 and R4.
Buy when the price falls from R3 to below R3 and rises again above R3. Targets will be 0.5%, 1% and 1.5% levels. Stop loss can be placed at R3 level. Wait for the price to rise to S3 and then sell or short when it falls below S3 again. Targets will be the S1, S2 and S3 levels, with Stop Losses placed above R4.
Situation 3. The opening price is between S3 and S4.
Wait for the price to go up to S3 and then buy when it goes above S3 again. Targets will be R1, R2 and R3 levels, with stops below S4.
Wait for the price to fall to S4 and then fall again below S4 to sell or sell short. Stop loss is placed above S3. Targets are 0.5%, 1% and 1.5%.
Situation 4. Open above R4
Buying at this level may be risky. Wait for the price to fall below R3. Sell short as soon as the price falls below R3. Stop loss is placed above (R4+R3)/2, targeting S1, S2 and S3.
Situation 5. Open below S4
Selling at this level can be risky as the price opens with a sharp drop. Wait for the price to rise above S3. Buy when the price rises above S3 and place a stop loss below (S4+S3)/2. The targets are R1, R2 and R3.